Flow Analytics
Views and completion rate over time
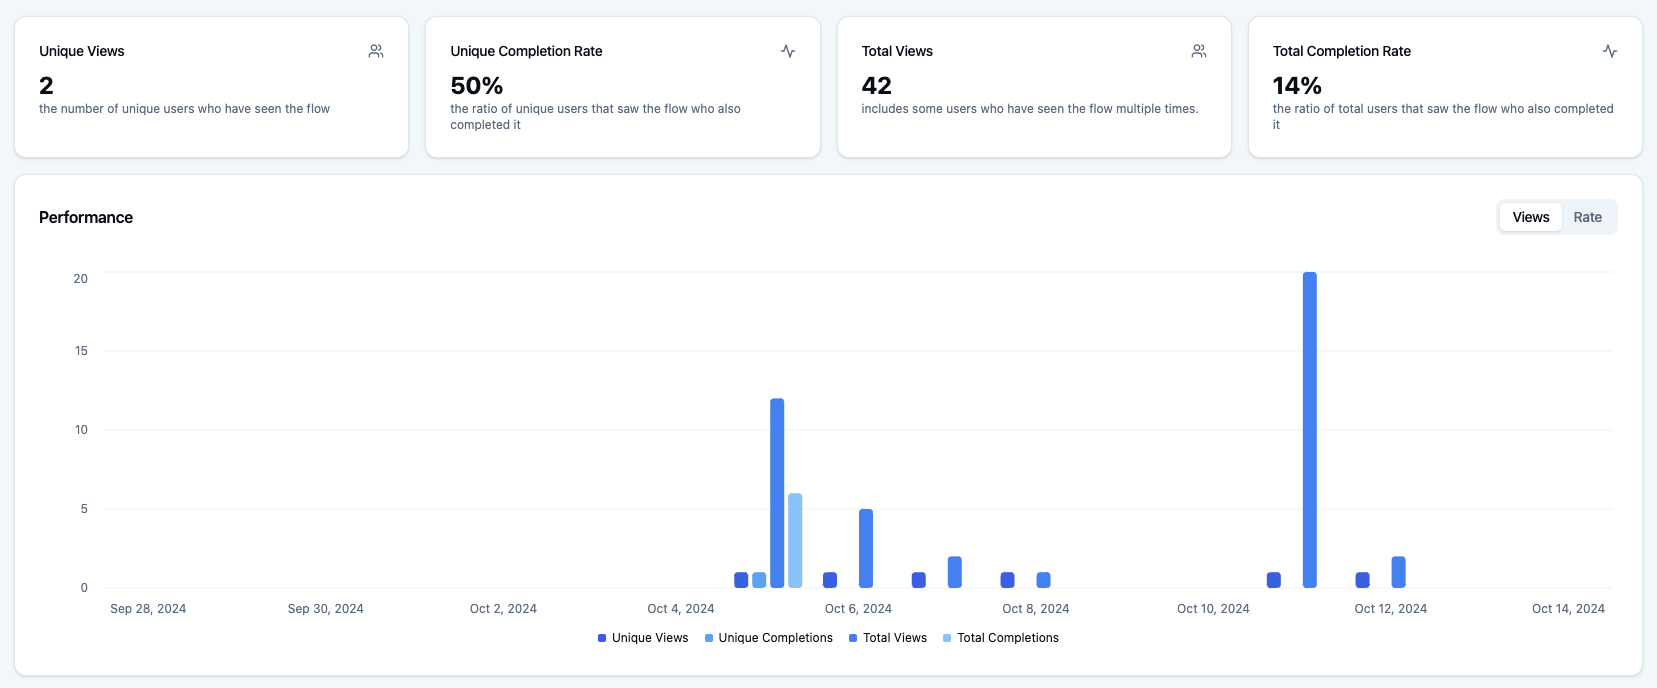
The Analytics tab under a flow shows how many users have seen your flow over time.

- Unique views tells you how many unique users have seen the flow in total. There’s also a total number of views, which may be higher if some users have seen the flow multiple times..
- Completion rate tells you the ratio of users that saw the flow who also completed it.
Setting up Companies
The Step funnel shows you where users drop off in the flow.

- Unique views shows how many users saw each step.
- View rate shows the share of users that saw the step relative to the total number of users that saw the flow.
- The width of the green bar corresponds to the View rate.
- If your flow is linear, the shape of the bars will resemble a funnel (wider at the top, narrower at the bottom).
- If there’s a steep drop after a certain step, it’s a hint that users have a hard time continuing from it or simply lose interest. Consider previewing the flow and look for issues, shorten the flow and/or make the content more concise and engaging.
- Note that if the flow has branching or steps that can be skipped, the chart may not look like an actual funnel, since a step’s bar may be shorter than a later step.
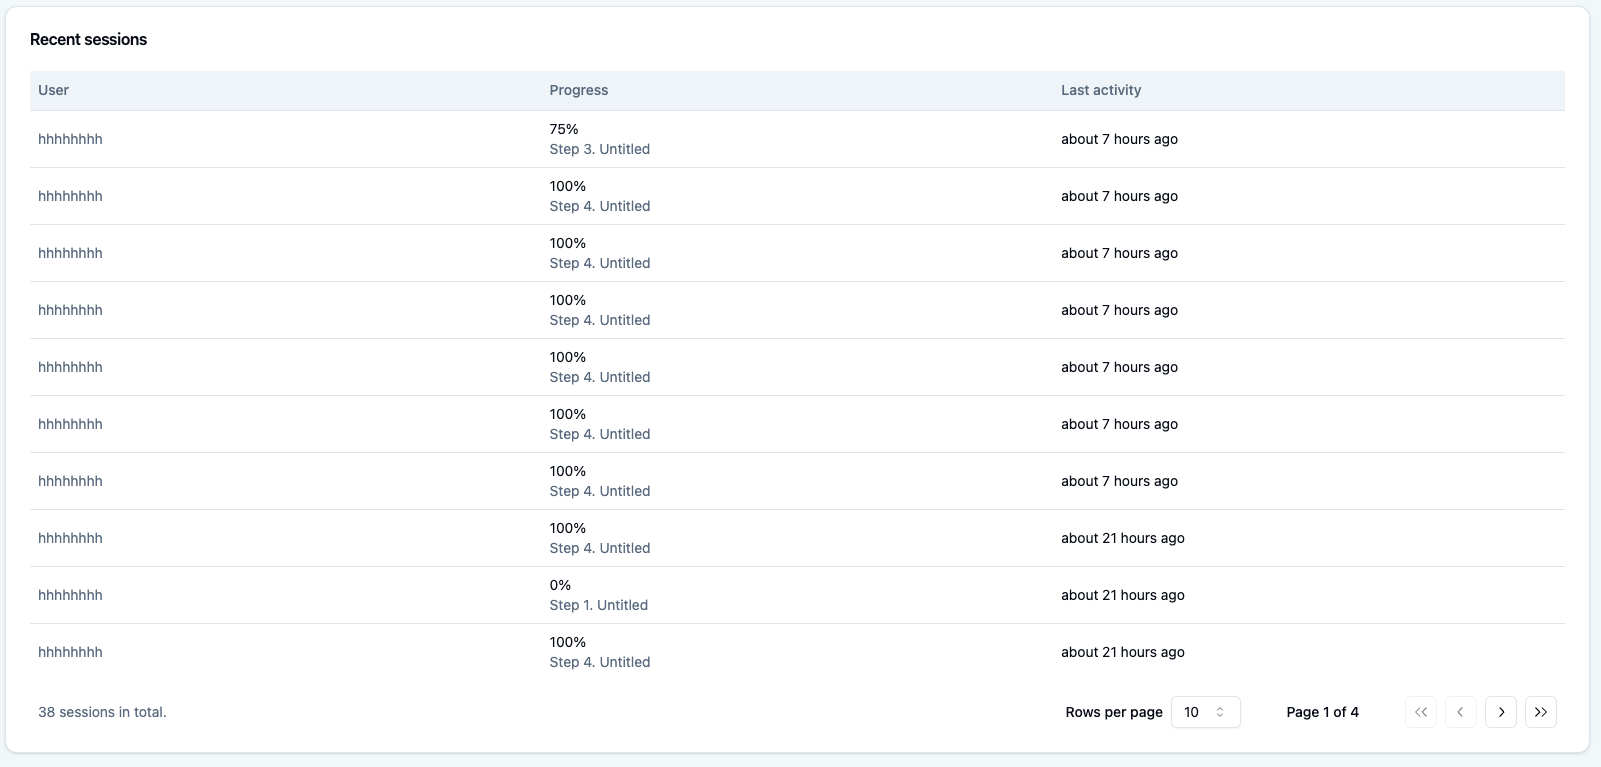
Recent sessions
A session is a user’s journey through a flow and corresponds to a view. A user may have multiple sessions of a flow, which will result in multiple views (though only 1 unique view).
This list shows users that most recently saw the flow.

- You can click a user’s name to go to their profile, or click an individual row to view more information about the session.
- Each row contains the session’s current progress: How far they’ve gotten, whether they’ve completed/dismissed the flow, and which step they’re currently on.
